Safety teams often know where risk is rising before Finance can see a financial result. Near misses, unsafe behaviors, congestion, and repeat corrective actions all point to exposure, but those signals rarely arrive in a format that fits a budget review. To earn support for safety investment, EHS leaders need to connect operational risk to costs Finance can audit, challenge, and include in planning.
Start with costs Finance can verify
A strong business case starts with cost categories that already exist in company systems. Finance will give more weight to claim history, overtime, downtime logs, repair invoices, and audit findings than broad claims about culture or morale. Those softer benefits matter, but they should support the case rather than carry it.
Begin by listing the direct costs tied to safety events. Include medical expenses, workers’ compensation claims, legal fees, replacement labor, damaged equipment, lost production time, scrap, rework, and supervisor investigation hours. Then identify which owner can validate each number. Risk Management may own claims. Operations may own production value per hour. Maintenance may have its own repair costs. HR may own fully loaded labor costs.
- Use actual facility data before outside benchmarks.
- Separate hard costs from directional estimates.
- Document the source of every input.
- Show assumptions clearly enough for Finance to revise them.
The aim is to build a model that can survive scrutiny. If Finance changes an assumption and the case still holds, the safety investment becomes easier to defend.
Build a clean operating baseline
Safety performance has to be measured against a steady before view. Without a baseline, teams can confuse normal variation with improvement. Pull several months of data before any major intervention, then break it down by line, shift, zone, event type, and severity. The more specific the baseline, the easier it is to show where value changed.
Do not stop at incident counts. A recordable injury is a lagging result, and many sites have too few events to create a useful short-term model. Add leading indicators that show exposure earlier, such as near misses, speed events, restricted-area entries, blocked walkways, repeated PPE gaps, or forklift and pedestrian interactions. These signals help explain where costs may appear later.
Pair those safety signals with operational measures. For example, connect a high-risk intersection to stoppage minutes, supervisor response time, rework, or missed dispatch targets. A safety issue that also slows material flow gives EHS and Operations a shared financial story. It also gives Finance a clearer path from event data to P&L impact.
Translate safety signals into dollar ranges
Once the baseline is set, convert safety changes into conservative dollar ranges. The simplest method is to start with cost per event. If a facility averages three powered industrial truck claims per year and each claim has a documented average cost, the avoided-cost model can show what a reduction might mean. Keep the model cautious by using ranges and discount factors rather than guaranteed savings.
Downtime is often the clearest bridge between safety and financial performance. Calculate production value per minute, then agree with Operations and Finance on which minutes are truly recoverable. If a safety-related stop lasts 20 minutes, some output may be regained later in the shift. Some may be lost completely due to labor schedules, carrier cutoffs, or downstream constraints. The model should reflect that reality.
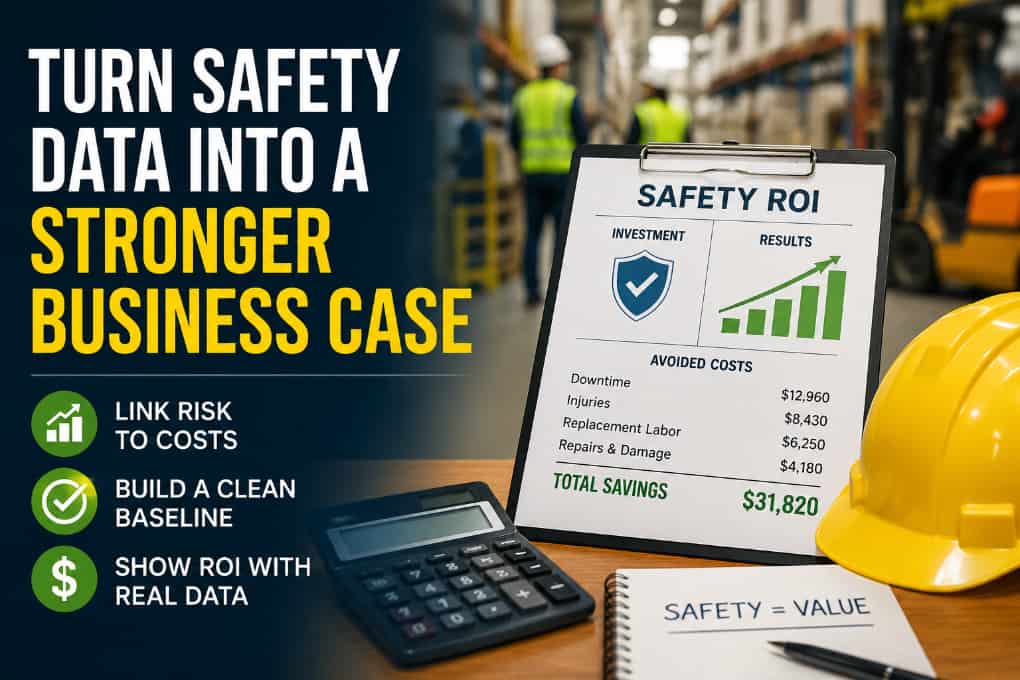
Consider a warehouse that sees repeated near misses at a dock crossing. The team improves floor markings, adjusts traffic flow, and adds more frequent supervisor checks. Near misses in that zone fall, safety stops drop from 10 per month to four, and each stop averages 12 minutes. If Finance agrees that each lost minute carries $180 in unrecovered value, the monthly recovered value estimate is 72 minutes multiplied by $180, or $12,960. That estimate should still be labeled as modeled value, not cash already captured.
The OSHA Safety Pays estimator can help teams frame injury cost impact as a starting point, but facility-specific data usually creates a stronger case.
Present attribution without overclaiming
Finance will ask if the safety work caused the financial change. A credible answer depends on attribution discipline. Record the intervention date, the affected zone, the specific behavior or hazard, the expected financial effect, and the comparison group. If the dock crossing improved but other crossings stayed flat, the case became stronger. If every area improved at the same time, another factor may have contributed.
Use a simple chain of evidence. First, show the safety signal changed. Then show the related operational measure changed. Then show the cost impact. For example: restricted-area entries declined after access changes, safety-related stoppages in that area declined, and replacement labor hours fell. Each step should connect to a data source.
It is also worth showing what the model excludes. If the calculation does not include morale, brand risk, say so. That restraint builds trust. It tells Finance that the EHS team is not inflating the case to win the budget. It also leaves room to discuss wider benefits after the hard-cost model has been accepted.
Turn safety data into a stronger business case
Safety performance becomes financially useful when it is specific, auditable, and tied to action. A good ROI model does not need dramatic language. It needs a baseline, clear cost inputs, zone-level evidence, conservative assumptions, and a repeatable method for tracking change over time.
Teams that want to strengthen this process can use guidance on proving EHS ROI to connect safety signals with avoided costs, recovered capacity, and measurable P&L outcomes. When EHS can show the financial effect of safer operations in terms Finance already trusts, safety becomes easier to fund, scale, and defend during budget planning.