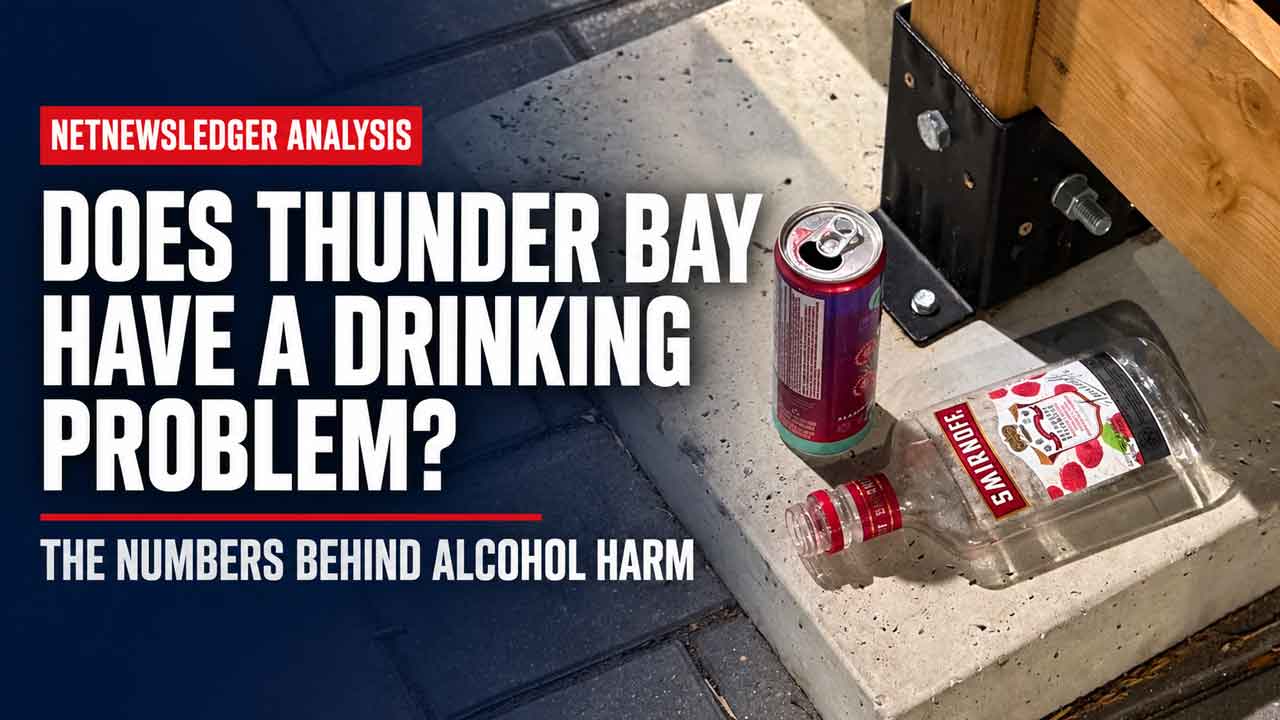
What the Data Says About Alcohol Use, Bar Density and Impaired Driving
THUNDER BAY – ANALYSIS – September 27, 2026 – Ask whether Thunder Bay has a drinking problem and the answer depends on what is being measured.
There is no reliable public database showing exactly how many litres of alcohol are consumed by the average resident of Thunder Bay or any other Ontario city. Statistics Canada publishes alcohol sales per person for Ontario, but not for individual municipalities. Alcohol bought in one place can also be consumed somewhere else, and survey respondents often under-report how much they drink.
However, several strong indicators point in the same direction.
The Thunder Bay District has a higher rate of risky alcohol use than Ontario as a whole.
Alcohol accounts for a larger share of local deaths, hospital stays and emergency department visits. Thunder Bay’s impaired-driving rate is also well above the provincial rate.
The evidence supports a careful conclusion: Thunder Bay has a significant population-level alcohol harm problem, even though the available data does not prove that it is Ontario’s heaviest-drinking or most heavily licensed city.
The Short Answer
- 35.5 per cent of Thunder Bay District residents aged 12 and older reported consuming three or more standard drinks in the previous seven days in the latest comparable Public Health Ontario survey cycle, 2019-2020. The Ontario figure was 29.7 per cent.
- 20.4 per cent of Thunder Bay District residents met Public Health Ontario’s heavy-drinking measure, compared with 16.0 per cent across Ontario.
- In an average year, alcohol was estimated to contribute to 85 deaths, 568 hospitalizations and 5,827 emergency department visits in Thunder Bay District.
- An analysis of the current AGCO licence file found approximately 159 active or continuing on-premise liquor licences in Thunder Bay, equal to about 14.6 licences per 10,000 residents using the 2021 Census population.
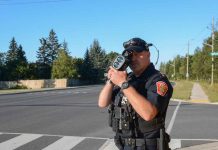
- Statistics Canada recorded 224 impaired-driving incidents in the Thunder Bay census metropolitan area in 2025, a rate of 169.74 per 100,000 people. Ontario’s rate was 94.67.
- Thunder Bay Police separately reported 445 impaired-driving charges in 2025. That is a charge count, not a count of drivers or incidents.
Why There Is No Honest City-by-City Litres-Consumed Ranking
Statistics Canada’s alcohol sales table is provincial and territorial. For 2024-2025, legal alcohol sales in Ontario were equal to 6.3 litres of absolute alcohol per resident aged 15 and older.
That is useful provincial context, but it cannot be assigned to Thunder Bay.
Statistics Canada also cautions that sales volume should not be treated as a perfect measure of consumption. The figures exclude unrecorded alcohol and can be affected by tourism, travel and purchases made outside a person’s home community.
A claim that Thunder Bay residents consume a specific number of litres per person would therefore go beyond the available evidence.
The closest defensible local comparison is self-reported alcohol use from the Canadian Community Health Survey, published by Public Health Ontario at the public-health-unit level.
Thunder Bay Reports More Risky Drinking Than Ontario
The latest Public Health Ontario Alcohol Use Snapshot provides comparable estimates for the 2019-2020 survey cycle. These are age-standardized rates for residents aged 12 and older.
| Public health area | Three or more drinks in past seven days | Heavy drinking |
|---|---|---|
| Public Health Sudbury and Districts | 40.9% | 29.2% |
| North Bay Parry Sound District | 39.7% | 25.8% |
| Peterborough | 38.6% | 21.0% |
| Kingston, Frontenac, Lennox and Addington | 36.0% | 20.0% |
| Thunder Bay District | 35.5% | 20.4% |
| Algoma | 34.7% | 21.1% |
| Middlesex-London | 29.6% | 14.7% |
| Ontario | 29.7% | 16.0% |
| Toronto | 25.6% | 12.0% |
Public Health Ontario defines heavy drinking as five or more drinks for males, or four or more for females, on one occasion at least once per month.
Thunder Bay was above Ontario on both measures, but it was not the highest area in the comparison. Sudbury and North Bay Parry Sound reported higher rates. That matters because the evidence supports concern, but not a claim that Thunder Bay is uniquely bad.
The survey also has limits. It covers the Thunder Bay District Health Unit area, not only the City of Thunder Bay. It relies on self-reporting, and Public Health Ontario advises caution with the 2019-2020 cycle because the COVID-19 pandemic affected survey collection.
The Strongest Evidence Is the Harm Showing Up in Hospitals and Death Records
Public Health Ontario estimated the burden of disease and injury caused by alcohol using health records and established alcohol-attributable fractions. In Thunder Bay District, the average annual toll among people aged 15 and older was:
- 85 deaths, representing 5.2 per cent of all deaths;
- 568 hospitalizations, representing 3.2 per cent of all hospital stays; and
- 5,827 emergency department visits, representing 5.2 per cent of all emergency visits.
| Health area | Alcohol-attributable deaths | Hospitalizations | Emergency visits |
|---|---|---|---|
| Thunder Bay District | 5.2% | 3.2% | 5.2% |
| Sudbury and Districts | 4.5% | 2.3% | 3.3% |
| North Bay Parry Sound District | 4.6% | 2.2% | 3.0% |
| Toronto | 4.6% | 2.3% | 4.5% |
These percentages are more revealing than raw counts because the regions have very different populations. Thunder Bay’s alcohol-attributable share was higher on all three measures shown.
The category includes more than alcohol poisoning or liver disease. Alcohol contributes to cancers, heart and digestive conditions, injuries, violence, suicide and motor vehicle collisions. It can also harm people who do not drink.
How Many Licensed Establishments Does Thunder Bay Have?
The Alcohol and Gaming Commission of Ontario publishes a daily file of liquor sales licences for bars, restaurants, lounges, nightclubs, hotels and other premises that may sell and serve alcohol.
NetNewsLedger downloaded the file on September 27, 2026. The file had been updated September 26. We counted licences listed as Active or Deemed to Continue and excluded expired, revoked and suspended records. Rates use 2021 Census municipal populations so every city has the same denominator.
| Municipality | Active or continuing licences | Licences per 10,000 residents |
|---|---|---|
| Kenora | 33 | 22.0 |
| Peterborough | 150 | 17.9 |
| Kingston | 220 | 16.6 |
| Toronto | 4,356 | 15.6 |
| North Bay | 81 | 15.4 |
| Thunder Bay | 159 | 14.6 |
| Sault Ste. Marie | 104 | 14.4 |
| Greater Sudbury | 195 | 11.7 |
| London | 468 | 11.1 |
Thunder Bay’s rate is substantial but sits in the middle of this selected group. The table does not show that Thunder Bay has the most licensed premises per resident.
Several cautions are necessary. The AGCO file is organized by mailing city, so former municipal names were combined for Toronto, Greater Sudbury and Sault Ste. Marie.
A licence is not the same as one bar: hotels, restaurants and other businesses are included. The measure does not account for seating capacity, hours, annual sales, seasonal operations or the number of tourists.
Kenora’s high rate, for example, is likely influenced by serving visitors and a wider regional market.
It also excludes the growing off-premise market from the calculation above. Thunder Bay District Health Unit reported that, as of September 5, 2024, the City of Thunder Bay had exceeded the recommended threshold of two or fewer off-premise alcohol outlets per 10,000 residents aged 15 and older.
Those outlets include LCBO, Beer Store, grocery and convenience locations.
Impaired Driving: Thunder Bay Is Well Above Ontario
Statistics Canada’s Uniform Crime Reporting data provides the cleanest comparison among police metropolitan areas. The latest release covers 2025.
| Area | Impaired-driving incidents | Rate per 100,000 | Persons charged | Charged rate, age 12+ |
|---|---|---|---|---|
| Greater Sudbury CMA | 374 | 189.13 | 370 | 209.07 |
| Thunder Bay CMA | 224 | 169.74 | 214 | 181.17 |
| Barrie CMA | 391 | 130.05 | 396 | 151.51 |
| Peterborough CMA | 157 | 106.89 | 157 | 119.23 |
| London CMA | 676 | 106.57 | 650 | 116.86 |
| Ontario | 15,391 | 94.67 | 14,912 | 103.59 |
| Kingston CMA | 141 | 73.87 | 139 | 81.13 |
| Toronto CMA | 4,880 | 69.49 | 4,722 | 75.41 |
Thunder Bay’s 2025 incident rate was approximately 79 per cent higher than the Ontario rate. Its rate of persons charged was about 75 per cent higher. Greater Sudbury was higher, while every other comparison area in the table was lower.
Raw counts alone can mislead. Toronto recorded far more incidents, but it also has a much larger population. Rates are needed to compare the relative frequency of police-reported incidents.
Why Thunder Bay Police Says 445 Charges While Statistics Canada Says 214 People Charged
Thunder Bay Police Service reported 445 impaired-driving charges in its 2025 annual results. Statistics Canada counted 214 persons charged and 224 incidents for the Thunder Bay CMA.
Those figures do not necessarily conflict. A driver may face more than one charge arising from the same stop, such as impaired operation, a blood-alcohol concentration offence, refusal to provide a sample or dangerous operation. Statistics Canada organizes police data by incidents and people, while a police annual report may count each charge laid.
Thunder Bay Police had reported 201 impaired-driving charges and 70 collisions involving impaired drivers in 2023. The increase to 445 charges in 2025 is concerning, but it cannot be interpreted as proof that the number of impaired drivers more than doubled. Enforcement intensity, roadside screening, reporting practices and the number of charges per accused can all change the count.
What Does “Thunder Bay District” Mean?
There is no single public number that cleanly represents every impaired-driving charge across the entire geographic District of Thunder Bay.
Thunder Bay Police Service polices the City of Thunder Bay and Oliver Paipoonge. The Ontario Provincial Police and other services cover highways and communities elsewhere in the district. Statistics Canada’s comparison is for the Thunder Bay police metropolitan area, not the full census or judicial district.
For that reason, this analysis uses three separate descriptions:
- Thunder Bay District Health Unit for health and survey data;
- City of Thunder Bay for the liquor-licence calculation; and
- Thunder Bay CMA for comparable police-reported impaired-driving data.
Combining those boundaries into one rate would create a false level of precision.
Does More Availability Cause More Harm?
Outlet density is not proof that any one restaurant, bar or store caused a health or policing outcome. It is a population-level risk factor.
Thunder Bay District Health Unit says research links a greater density of on-premise and off-premise alcohol outlets with more consumption and harms, including injuries, illness, assault, public disorder and violent crime. The effect can be influenced by pricing, hours, marketing, transportation, tourism, poverty, housing and access to treatment.
The local data is consistent with an availability-and-harm concern, but it does not establish that the number of bars alone caused Thunder Bay’s hospital or impaired-driving rates.
What Could Thunder Bay Do?
A serious response would treat alcohol as a health, transportation and community-safety issue, not simply a matter for police.
- Publish one annual alcohol-harm dashboard. The City, TBDHU, police, hospitals and paramedics could report comparable figures for sales availability, ambulance calls, emergency visits, collisions, incidents, people charged and charge counts.
- Adopt a stronger municipal alcohol policy. City facilities, festivals and municipally supported events should use consistent rules for service, advertising, training and safe transportation.
- Use planning powers carefully. Where provincial law permits, zoning and licensing comments can consider clustering, proximity to schools and treatment sites, and neighbourhood impacts.
- Improve late-night transportation. Reliable transit, taxi and designated-driver options reduce the chance that people drive after drinking.
- Support screening and treatment. Primary care, emergency departments and community agencies need pathways for early intervention, withdrawal management, counselling and recovery support.
- Continue visible impaired-driving enforcement. RIDE programs and mandatory alcohol screening can deter driving after drinking, but enforcement data should distinguish drivers, incidents and charges.
- Ask the province for stronger tools. Pricing, warning labels, retail rules and most licensing powers are provincial responsibilities. Municipalities cannot solve the issue alone.
The Bottom Line
Thunder Bay should not be labelled through stereotype. Many residents do not drink, most people who drink do not commit crimes, and alcohol dependence is a health condition rather than a moral failure.
Still, the numbers are too consistent to dismiss. Risky drinking is above the Ontario average. Alcohol consumes a larger share of local health-system resources. Off-premise access has expanded beyond a public-health benchmark. The impaired-driving rate is far above the provincial rate.
Thunder Bay does not need an exaggerated claim that it is Ontario’s worst drinking city. It already has enough evidence to justify a coordinated alcohol-harm strategy with measurable targets and public reporting.
Methodology and Data Limits
- The alcohol-use comparison uses Public Health Ontario’s 2019-2020 Canadian Community Health Survey estimates. These are the latest comparable PHU figures in the official Alcohol Use Snapshot.
- Public health unit areas are not the same as municipal boundaries.
- The licence calculation uses AGCO records listed as Active or Deemed to Continue on September 27, 2026, and 2021 Census municipal populations. Rates are approximate because populations have changed.
- Former municipal or mailing-city names were combined for Toronto, Greater Sudbury and Sault Ste. Marie. Thunder Bay includes two records entered as “Thunderbay.”
- The impaired-driving comparison uses Statistics Canada 2025 police metropolitan area data. Police-reported rates are affected by enforcement practices, screening, legislation and reporting.
- A charge is not a conviction. One incident or accused person can generate multiple charges.
Ready to Cut Back or Quit Drinking? Help Is Available
A person does not have to wait until alcohol has caused a crisis before asking for help. Support is available for people who want to stop drinking completely, reduce how much they drink or simply understand whether alcohol is becoming a problem.
A good first step is speaking with a family doctor, nurse practitioner or addiction counsellor. Treatment can include counselling, peer support, withdrawal management and, when appropriate, medication to reduce cravings.
- Thunder Bay Counselling: Call 807-684-1880 to arrange an addiction assessment. A Thursday information session is also offered at 1:15 p.m.
- St. Joseph’s Care Group Withdrawal Management: The voluntary, no-fee program at 500 Oliver Road is open around the clock for people aged 16 and older. Call 807-623-6515 to ask about bed availability.
- ConnexOntario: Call 1-866-531-2600 or visit ConnexOntario.ca. The free and confidential service operates 24 hours a day and can locate counselling, withdrawal and treatment programs anywhere in Ontario.
- Alcoholics Anonymous: Thunder Bay’s Lakehead Intergroup answering service can be reached at 807-623-1712. AA also offers in-person and online meetings. :contentReference[oaicite:4]{index=4}
- Ontario 211: Dial 2-1-1 for help finding local health and community services.
Important: A person who drinks heavily or regularly should not assume it is safe to stop suddenly without medical advice. Alcohol withdrawal can begin within six to 12 hours and can become dangerous. Severe shaking, confusion, hallucinations or seizures require emergency medical attention. Call 911 or go to the nearest emergency department.
Recovery does not follow one path. For some people, success begins with one alcohol-free day. For others, medically supported withdrawal and long-term treatment are needed. The important step is reaching out before the situation becomes worse.