
THUNDER BAY – SPECIAL TO NNL – The Common Voice Northwest Energy Task Force (ETF) continues to fine tune the data available to it and to further develop its understanding of the realities, both current and future, of the electrical system of Northwestern Ontario. Following an exchange of data with the Ontario Power Authority, which included a face-to-face meeting in Thunder Bay on October 1 and a further consultation on Oct 2 and 15 the ETF has prepared this report which not only compares the projections of both organizations but identifies key dates when enhanced thermal capacity is essential to meeting the known and projected demands of the region.
A number of new mines, led by the gold sector, will come into production in Northwestern Ontario between 2015 and 2022, supplementing a vibrant mine production industry currently employing 3500-4000 personnel. Of concern, and as identified by SNC Lavalin in the Advantage Northwest: Mining Readiness Strategy (2013) report highlights, “a lack of sufficient power is a critical, limiting factor for development of the mining sector” in Northwestern Ontario.
Specifically five new gold mines, two of which are in construction now, will be in production by 2017, ultimately employing 1540 direct personnel. In addition, from 2018 to 2022 new gold, as well as copper, nickel, palladium and graphite mines are forecast to be in production. We need to have the power available to meet those needs!
Load Projections
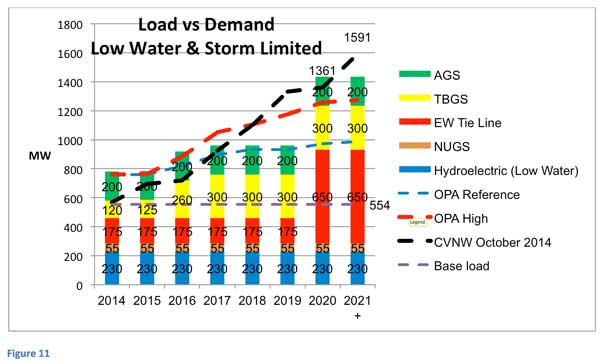
The key element in the load projections is the 23 or so mines that are working their way through the development process. Utilizing the resources of the Project Manager of Mining for the Thunder Bay Community Economic Development Commission (a member of the ETF) the ETF has projected a 2020 load of 1361 MW while the OPA, in their ‘High Scenario’ are projecting 1257 a difference of 104 MW. The difference expands to 319 MW post 2021.
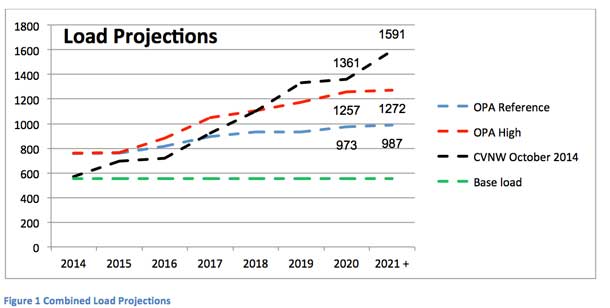
The ETF is confident that all of the mines listed in its projections will come on stream during the planning period. Those that don’t will be replaced by other mines that have not yet reached the stage of a feasibility study. The OPA on the other hand have not placed the same level on certainty on the projections as the ETF has. The OPA offers three scenarios – low, reference and high. They have verbally stated that they do not think that the low option is what they should plan for. The Energy Task Force believes that the reference projection is lower than every indication suggests will happen.
The above chart reflects the one ETF projected load and the OPA’s Reference and High projections along with the current base load. As can be seen in the above chart the difference between the ETF’s projection and the OPA’s high reference is 104 MW in 2020. There is a greater difference of opinion when the Reference load is compared leaving a difference of 388 MW.
As noted earlier, the ETF is of the opinion that the entire projected load will come on stream at some point either through the mines listed or through mines not yet identified as feasible or under a longer timeframe. The OPA is taking a much narrower view of the future of the Northwest consistent with their earlier statement of needing to see the “whites of their eyes” before they become confident that a particular mine will come on stream. The problem facing the mining industry is that there is such a long lead time to get to the point of commencing development that the remaining time is not sufficient to get the necessary electrical supply in place.
In much the same way that the Province of Ontario decreed many years ago that all homes should be built with a 200 AMP service, the likelihood that most of those homes would require more than 60 or 100 AMP was pretty remote. The Energy Task Force holds the position that the generation and transmission facilities of the Northwest should be able to meet the potential of the region regardless of the specific in-service date of the new mine.
The ETF has examined in detail a range of variables that will have an impact on the ability of the Northwest to meet the energy needs of its industry and residents. Each of the following sections will look at each year between now and 2020 and beyond. In addition, other key variables include hydraulic water levels and the availability of thermal generation – either as a peak supply or as a continuous supply.
First an explanation of the sources of power is required.
Hydraulic
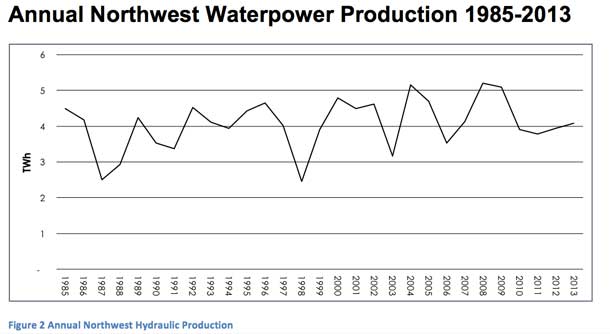
The backbone of the Northwest’s system is hydraulic generation from 11 Ontario Power Generation facilities across the region. The combined output is 700 MW. During drought situations that output is reduced to 230 MW while at medium water levels 436 MW is the level of production. The following OPA Chart shows the variations in water levels over a 28 year period. The reader will note that the valleys (ie low water periods are becoming more frequent and lasting longer each time. In fact there has been low water an average of every 4 years since 1988. In some cases low water occurs every three years, while once with a five year interval between lows.
Annual Northwest Waterpower Production 1985-2013
It should be noted that the chart above represents the generation from water during this period and not the actual water volume available to create electricity[1]. It is also important to note that there are times in each year, where the amount of water available is more than OPG and NUG hydro generators can handle and it must be ‘spilled’ in order to maintain compliance with the approved water management plans.
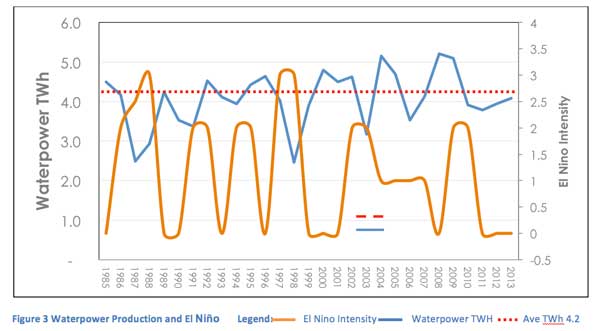
A comparison between the noted low water periods shown in Figure 2 and the El Niño weather patterns indicates that they are directly related. In fact, El Niño is appearing on average every 4 years as well. This is displayed in Figure 3. It is projected that “El Niño is favored to begin in the next 1-2 months and last into the spring of 2015 in the Northern Hemisphere”[2].
NUGS
Non utility generators (NUGS) are private suppliers of electricity. The majority of the NUGS are private hydraulic systems (52 MW) with one natural gas generator producing 38 MW on a consistent basis. During medium water levels the hydraulic NUGS are reduced to 32 MW and to 17 MW under low water levels. That results in the NUGS operating at 90, 70 and 55 MW for High, Medium and Low levels respectively.
EAST WEST TIE LINE
The existing East-West Tie that connects the Northwest to the Northeast and to Manitoba is the transmission equivalent to the TransCanada Highway. It is however, subjected to limitations during severe storms that traverse the region. The line’s normal capacity of 350 MW is reduced to 175 MW during the storm’s duration. That requires replacement energy to be found within the region – usually on very short notice. The best opportunity for that replacement is the dispatchable thermal generation from the Atikokan and Thunder Bay Generating Stations.
This is known as “storm limited.”
In 2020, Ontario expects an enhanced east west tie line to be in operation expanding the capacity of the connecting link to 650 MW. The design of the new line is such that it will not be affected by storms and will therefore be able to operate at full capacity.
THERMAL
The use of coal as a fuel at the Atikokan and Thunder Bay Generation Stations was eliminated by the Ontario Government. The Atikokan GS has been converted to burn biomass pellets. One unit of the Thunder Bay GS is being converted to consume advanced biomass. Both have a limited approved fuel supply for a defined period of time (Atikokan – 10 years, Thunder Bay – 5 years). Both are only available for peaking needs of the region and do not have the fuel to provide for continuous operation over a prolonged period of time.
The Energy Task Force is of the opinion that both units of the Thunder Bay GS need to be converted to utilize natural gas in order to meet the needs of the region. At the same time, the design of the conversion must ensure a continued option to utilize advanced biomass fuel both for peaking purposes and to assist in the development of an advanced biomass industry in the Northwest.
The Energy Task Force is also is of the opinion that the fuel supply for the Atikokan GS must be enhanced to assist in meeting the needs of the region. It may be that introduction of advanced biomass as a fuel for the Atikokan GS is a more cost effective option than expanding the storage capabilities of the facility or the ‘just in time’ delivery system from the supplier.
ADDITIONAL GENERATION
A number of organizations are working toward the development of additional sources of generation in the Northwest. The current “orange zone” status prevents these projects from coming on line until such time as there is new load which can absorb the new generation. The Energy Task Force supports the addition of new generation. In part, towards the end of the planning period outlined in this report, the existing supply, including the two thermal stations will be insufficient to meet the demand projected by the ETF. In addition, it makes broader economic sense to slightly reduce the maximum output of either of the two thermal generating stations in order to accommodate new producers, creating new jobs in the area.
Year by Year Analysis of Load vs Supply and The Role of Thermal
In order to understand the role that Thermal needs to play in the region, each year has been analysed based on three levels of water available to generate electricity – high, medium and low. Each of the sources of power is shown with the corresponding supply attributed to that source under the specific conditions referenced. The 2014 base load is shown consistently throughout all of the graphs. The ETF has chosen to only measure against the OPA’s high scenario as it is the position of the ETF that the OPA’s Reference projection is unreasonably low.
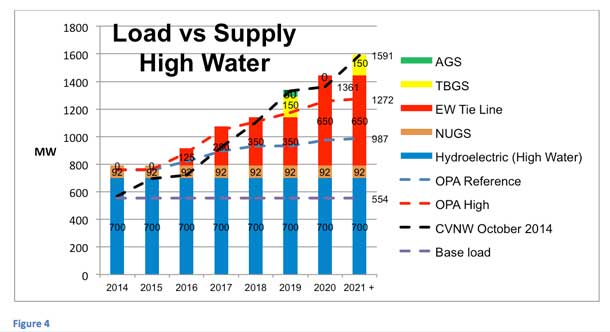
- HIGH WATER
Under the high water scenario the Northwest has sufficient supply until 2019 regardless of the projections by either the ETF or OPA. In 2019 however, under the OPA High Scenario a constant supply of power will be required from Thermal Generation Atikokan with sufficient fuel to generate 50MW continuously[3]. The ETF projects one unit of the Thunder Bay Generating Station will be needed full time at 150 MW to meet the anticipated load.
With the EW Tie expansion scheduled to come on line in 2020, the thermal output will no longer be immediately required. However once the additional mines come on stream post 2020 the full output of one unit of the TBGS will be required well into the future.
High Water Conclusion
- Atikokan GS must be able to operate continuously at 50 MW commencing in 2019
- Thunder Bay GS must be able to operate one unit at 150 MW commencing in 2021
- HIGH WATER UNDER STORM LIMITATIONS
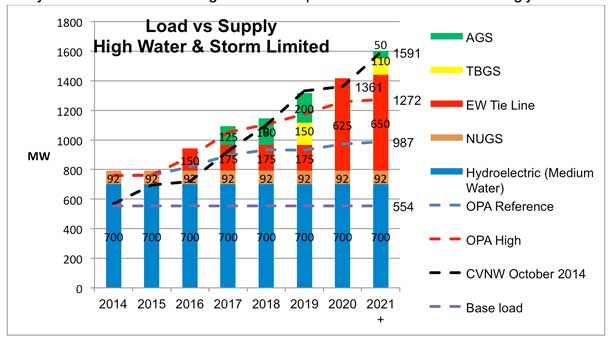
When hit by storms, the East West Tie’s capacity is dropped by 50%. As a result the ability of the tie line to meet regional load requirements is reduced accordingly.
During high water periods and until 2020 when the enhanced east west tie comes on line, those missing 175 MWs will need to be replaced by the peaking supply available from the Atikokan and Thunder Bay GS. The peaking supply will be needed commencing in 2017 and continuing through 2019 to meet both the ETF and the OPA High load projections. It is likely that the peaking supply will be needed in 2020 prior to the east west tie coming into service that year. Post 2020 the ETF’s projections will require thermal to meet the needs of the region.
High Water Storm Limited Conclusion:
- The peaking capabilities of the AGS and the TBGS are sufficient to meet the needs of the Northwest under either the ETF’s or the OPA’s projections and during high water periods until 2020. Further analysis will be required to determine the level of fuel supply that must be on hand to supply those peak loads.
- MEDIUM WATER
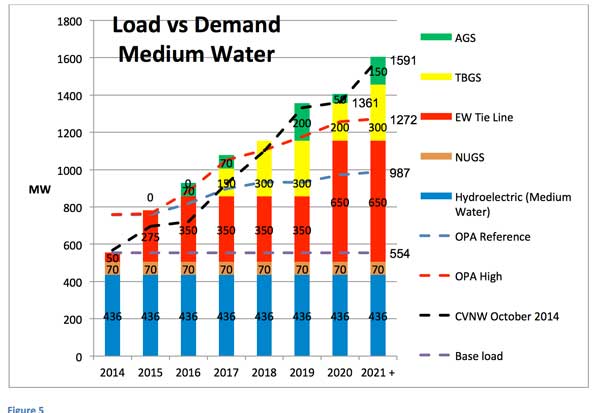
As water levels decline, the role of thermal changes significantly. Water levels tend to be relatively constant for a number of months at a time – that means that the replacement power must be continuous. Peaking supply is not an option.
Under the medium water scenario, and using the ETF load projections, the Atikokan GS must be able to operate continuously at 70 MW during medium water periods in 2016 and 2017 (unfortunately the AGS does not have a fuel supply or fuel storage that will require that to happen), then at its full capacity of 200 MW in 2019, 50MW in 2020 and at a minimum of 150 MW after 2020.
Thunder Bay GS, on the other hand must be able to operate continuously at 150 MW (one unit) in 2017, at 300 MW (two units) in 2018 and 2019 and then reduce to 200 MW in 2020. Post 2020 the TBGS will be required to operate at its full capacity for months at a time.
When the OPA’s high projection is used, Thunder Bay is needed to operate at a continuous level during mid water conditions commencing in 2017 with one unit (150MW) and in 2018 and 2019 with both units (300 MW). In 2020 the output will drop to 101 MW but will increase back to 300 MW commencing in 2021.
Under the OPA’s high scenario, Atikokan will need to be able to run continuously at 50 MW in 2020 during medium water periods but will not be required in any other years.
Medium Water Conclusion:
Under the ETF’s projections during medium water periods:
- By 2017 the TBGS must have one unit able to operate full time (150 MW)
- By 2018 the TBGS must have both units able to operate full time (300 MW)
- By 2019 the Atikokan GS must be able to operate at full capacity from then and into the future
Under the OPA’s High scenario during medium water periods
- In 2017 the TBGS must be able to operate one unit continuously at 150 MW
- In 2018 & 2019 the TBGS must be able to operate both units continuously at 300 MW
- In 2020 the TBGS must be able to operate one unit continuously at 101 MW
- In 2021 and beyond the TBGS must be able to operate both units continuously at 300 MW
- In 2020 the Atikokan GS will be needed to run continuously at 50 MW.
- MEDIUM WATER UNDER STORM LIMITATIONS
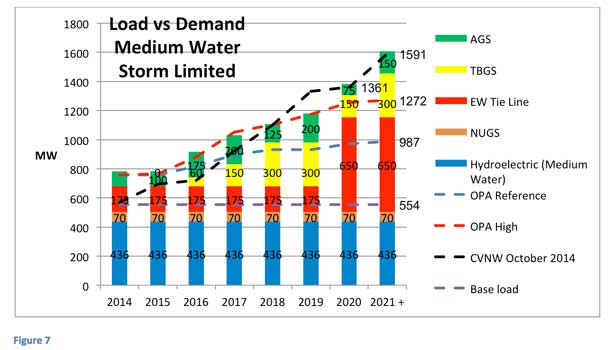
During medium water levels and under storm limitations, the thermal plants have both a peak and a continuous role to play in ensuring the region has the power they need when they need it. With the transfer ability of the East West tie limited to 175 MW that power needs to be met from within the region – for a number of hours at a time.
In 2015, under the OPA’s High scenario, Atikokan will be required to provide peaking power at 100 MW. The ETF’s projections for that year are lower and do not foresee the need to operate the AGS in a peaking situation. The Thunder Bay GS will not be required to meet the needs of the region under this scenario.
In 2016 under the OPA’s High scenario, Atikokan’s output is split between a requirement to run continuously at 70 MW and another 105 MW as a short term peak supply. Thunder Bay GS would provide 50 MW as a peak supply. Neither is required under the ETF’s projections.
In 2017 under both the OPA’s scenario and that of the ETF a continuous supply of up to 150 MW from one unit of the TBGS is required for a prolonged period of time. The AGS must add 130 MW of peaking power to the system over and above the 70MW of continuous supply required under the medium water scenario in order to meet the projections of the OPA.
Under both the OPA and ETF projections, in 2018 the TBGS is already operating continuously at its full 300 MW capacity. Atikokan will be required to provide 125 MW of peaking power during storm situations.
In 2019, under the OPA’s scenario, the TBGS will already be operating at its full capacity of 300 MW and Atikokan’s output will need to be increased to its full capacity of 200 MW as a peaking source of power. It will be essential that Atikokan has a sufficient fuel replenishment plan to ensure that frequent appearances of severe storms can be accommodated to this degree.
In 2019, under the ETF’s scenario it is important to note that even with the full output of both thermal plants (AGS at 200 MW and TBGS at 300 MW) the Northwest is short approximately 257 MW of power.
In 2020, the year that the enhanced East West Tie[4] is scheduled to be in service, under the ETF scenario, the TBGS will already be operating continuously at 200 MW with Atikokan providing 50 MW of continuous power. There are no storm limitations once the enhanced East West Tie is in operation. However, because of the increase in load, and the minimum output required, the AGS will operate at 75 MW and the TBGS at 150 MW – continuously.
Under the OPA scenario, the TBGS will be required to operate at 101 MW continuously while the AGS will not be required for system stability.
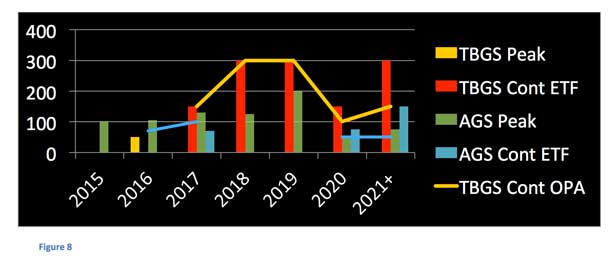
Medium Water Storm Limited Conclusion:
Under the OPA’s projections during medium water & storm periods:
- The Atikokan Generating Station will be required to run continuously at
- 70 MW in 2016,
- 100 MW in 2017 and
- 50 MW in 2020 and beyond.
- AGS will also be required for peaking power as follows:
- 2015 -100 MW,
- 2016 -105 MW,
- 2017 -130 MW,
- 2018 -125 MW and
- 2019 -200 MW.
- The Thunder Bay Generating Station will be required to run as follows:
- 2016 – 50 MW of peak
- 2017 – 150 MW continuous
- 2018 – 300 MW continuous
- 2019 – 300 MW continuous
- 2020 – 101 MW continuous
- 2021+ – 150 MW continuous
Under the ETF’s projections during medium water & storm periods:
- The Atikokan GS will be required to run as follows:
- 2017 – 70 MW continuous and 130 MW of peaking supply
- 2018 – 125 MW peaking supply
- 2019 – 200 MW peaking supply
- 2020 – 75 MW continuous
- 2021+- 150 MW continuous
- The Thunder Bay GS will be required to run as follows:
- 2017 – 150 MW continuous
- 2018 – 300 MW continuous
- 2019 – 300 MW continuous
- 2020 – 150 MW continuous
- 2021+ -300 MW continuous
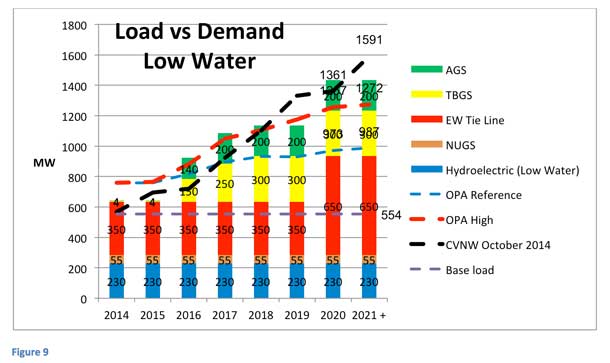
- LOW WATER
As noted earlier in this document, the Northwest is experiencing low water periods on average every four years. The OPA has identified, and the ETF concurs that the hydraulic output during low water periods is around 230 MW – approximately one third of the capacity of the hydraulic generators in the region. All energy planning must assume periods of drought and ensure that the 470 MW can be immediately and continually replaced.
In 2015 the Northwest does not have the capacity to meet the demands of the region on a continuous basis. Both the AGS and the TBGS only have peaking capacity and only for short periods of time can they produce at the full capacity of their plant. Should the expected drought occur, and there are already signs in one of the watersheds that it will, the Northwest will be short 61 MW under the ETF scenario and 124 MW under the OPA’s High projection and even their reference projection.
In 2016 under the ETF projections, the TBGS will be required to run continuously at 85 MW. However, under the OPA’s scenario the TBGS must run one unit at 150 MW on a continuous basis plus the AGS must provide 200 MW of continuous supply.[5]
In 2017, the projection of both organizations identify the need to have the TBGS operate continuously at 250 MW. Depending on which projection is utilized, the AGS will be required to operate full time at 39 MW (ETF) or 166 MW (OPA).[6]
In 2018 both load projections identify the need for the TBGS to operate continuously at 300 MW (both units) and the AGS continuously at 200 MW.[7]
In 2019, under both scenarios, both thermal plants are required to run flat out at their full capacity (AGS 200 MW, TBGS 300 MW) and the region will be short regardless of which set of projections are used. The ETF’s projections show a shortfall of 257 MW while the OPA’s is 124 MW. Neither are acceptable to the region and separate solutions must be identified and implemented, even if short term.
In 2020, with the enhanced East West Tie coming on line, there is some change, however both thermal stations will still be required for continuous operation. The TBGS will be required continuously under both the OPA and ETF projections, while the AGS is only required to run continuously at full capacity under the ETF scenario.
2021 and beyond will see the TBGS required for continuous operation at 272 MW and the AGS required for 50 MW[8] under the OPA’s projections while the ETF sees the need for the TBGS to operate at its licensed capacity of 300 MW with the AGS operating flat out at 200 MW. The region is short by 319 MW.
Low Water Conclusion:
Under the OPA’s projections during low water periods:
- In 2015 the regional will not have the power it needs to meet demand
- The Thunder Bay Generating Station will be required to run as follows:
- 2016 – 150 MW continuous
- 2017 – 250 MW continuous
- 2018 – 300 MW continuous
- 2019 – 300 MW continuous
- 2020 – 300 MW continuous
- 2021+ – 300 MW continuous
- The Atikokan Generating Station will be required to run as follows:
- 2016 – 200 MW continuous
- 2017 – 166 MW continuous
- 2018 – 200 MW continuous
- 2019 – 200 MW continuous
- 2020 – 0 MW continuous
- 2021+ – 200 MW continuous
Under the ETF’s projections during low water periods:
- In 2015 the region will not have the power it needs to meet demand
- The Thunder Bay Generating Station will be required to run as follows:
- 2016 – 85 MW continuous
- 2017 – 250 MW continuous
- 2018 – 300 MW continuous
- 2019 – 300 MW continuous
- 2020 – 300 MW continuous
- 2021+ -272 MW continuous
- The Atikokan Generating Station will be required to run as follows:
- 2016 – 200 MW continuous
- 2017 – 39 MW continuous
- 2018 – 200 MW continuous
- 2019 – 200 MW continuous
- 2020 – 0 MW continuous
- 2021+ – 200 MW continuous
- LOW WATER UNDER STORM LIMITATIONS
 Until the East West Tie enhancement is in place the Northwest will be subject to storm limitations that reduce the capacity of the trunk system to meet the need of the system. The 175 MW reductions must be met internally by the region.
In 2015 it has already been noted that the necessary power is not continuously available to meet the needs of the region. It is available, however, to meet the short term peaking requirements dictated by storm limitations. Under the ETF’s projections, the TBGS will be needed for peaking at 120 MW. That remains true under the OPA’s but in addition the AGS will be required to provide peak power at 200 MW.
In 2016, under the OPA’s mid water scenario, the TBGS is already operating continuously at 150 MW. Peaking supply of 110 MW will be required from the TBGS. Under the ETF’s projections, the continuous 85 MW will be increased by 115 MW for peaking supply. The AGS, already operating at 200 MW continuous will not be available for additional peaking supply under either scenario.
Commencing in 2017 and continuing through to 2020 when the enhanced East West Tie comes on line the projections from both the OPA and the ETF show the requirement for the TBGS and the AGS to be operating at their full capacity on a continuous basis. In 2018 and 2019 significant shortfalls in the region will occur. In 2018 the shortfall for both scenarios is 146 MW. In 2019, the ETF’s predicted shortfall is 401 MW while the OPA’s is 297 MW.
In 2020 the ETF’s projection requires both TBGS and AGS to operate continuously at full capacity. The OPA’s high scenario negates the need for the AGS.
In 2021 and beyond, during low water, under both organizations the full output of the TBGS is required on a continuous basis. The AGS is only required at full continuous capacity under the ETF’s projections. A significant shortfall of 156 MW will exist into the future.
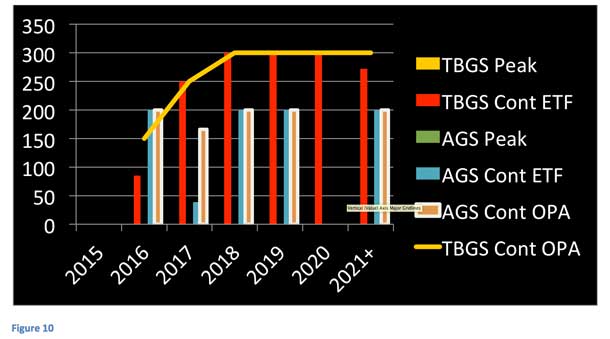
Low Water Storm Limited Conclusion:
Under the OPA’s projections during low water and storm periods:
- The Thunder Bay Generating Station will be required to run as follows:
- 2015 – 120 MW peaking supply
- 2016 – 150 MW continuous and 110 MW of peaking supply
- 2017 – 300 MW continuous
- 2018 – 300 MW continuous
- 2019 – 300 MW continuous
- 2020 – 300 MW continuous
- 2021+ -300 MW continuous
- The Atikokan Generating Station will be required to run as follows:
- 2015 – 200 MW peaking
- 2016 – 200 MW continuous
- 2017 – 200 MW continuous
- 2018 – 200 MW continuous
- 2019 – 200 MW continuous
- 2020 – 0 MW continuous
- 2021+ – 200 MW continuous
Under the ETF’s projections during low water and storm periods:
- The Thunder Bay Generating Station will be required to run as follows:
- 2015 – 120 MW peaking supply
- 2016 – 85 MW continuous and 115 MW peaking supply
- 2017 – 300 MW continuous
- 2018 – 300 MW continuous
- 2019 – 300 MW continuous
- 2020 – 300 MW continuous
- 2021+ -300 MW continuous
- The Atikokan Generating Station will be required to run as follows:
- 2015 – 200 MW continuous
- 2016 – 200 MW continuous
- 2017 – 200 MW continuous
- 2018 – 200 MW continuous
- 2019 – 200 MW continuous
- 2020 – 200 MW continuous
- 2021+ -200 MW continuous
Conclusion
Under both the ETF’s and OPA’s scenarios it is clear that the full capacity of both the Thunder Bay Generating Station and the Atikokan Generating Station will be required at some point prior to 2020.
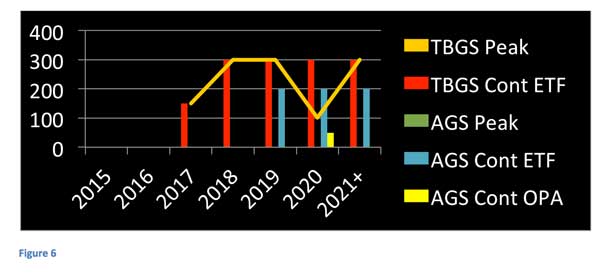
Thunder Bay Generating Station
The analysis provided in this document indicates that the Thunder Bay Generating Station will be required for full time operation regardless of the organization creating the projections and under the following circumstances and years (number in purple indicate both OPA and ETF projections, in red, the OPA and black the ETF):
| Year | Variable | Continuous MW | Peak MW |
| 2015 | |||
| 2016 | Medium Water Storm Limited & Low Water | 150 | 50 |
| 2017 | Medium Water & Low Water | 150/250 | |
| 2018 | Medium & Low Water | 300 | |
| 2019 | Medium & Low Water | 300 | |
| 2020 | Medium Water & Low Water | 101/300 | |
| 2021+ | Medium Water & Low Water | 300/200 |
The existing advanced biomass fuel supply must be enhanced significantly if the TBGS is to meet the demand of 150 MW of continuous power required in 2016. It is estimated that it would take approximately 680,000 tonnes of advanced biomass to create 150 MW on a continuous basis.
It takes at least 2 years to convert one unit (unit 3) to natural gas and to install the required gas supply. Work must commence immediately if the TBGS is to be in a position to operate one unit continuously commencing in 2017. The second unit needs to be converted by 2018 in order that the full 300 MW will be available to meet the needs of the region.[9]
Atikokan Generating Station
| Year | Variable | Continuous MW | Peak MW |
| 2015 | Medium Water Storm Limited | 100 | |
| 2016 | Medium Water Storm Limited & Low Water | 70/200 | 105 |
| 2017 | Medium Water Storm Limited & Low Water | 70/100/166 | 130 |
| 2018 | Medium Water Storm Limited | 200 | 125 |
| 2019 | Medium Water Storm Limited | 200 | 200 |
| 2020 | Medium Water & Low Water | 50 | |
| 2021+ | Medium Water & Low Water | 75/200 |
Atikokan will need to be able to provide a continuous supply of energy at the rate of 200 MW by 2016. Work must begin immediately to negotiate an additional fuel supply and delivery schedule to ensure that the plant can operate continuously for an extended period of time. OPG advises that the AGS has the capacity to receive and unload three to four trucks an hour continuously and should the fuel supply be available to that degree and with that frequency the plant could operate 24/7, 365 days of the year.
Alternatively, should advanced biomass be available it could augment the supply of the white pellets and be stored in the open on site to fill in any gaps during the just in time delivery.
At the same time, efforts to create domestic advanced biomass production facilities becomes viable as it is likely that a minimum of 100,000 tonnes of production will be required to make a single pellet manufacturing facility viable.[10]
[1] Some of the watersheds are regulated to ensure the survival of fish species, shoreline protection etc. At other times water is ‘spilled’ as power is being supplied by other renewable (wind and solar) albeit at more expensive prices.
[2] El Niño/Southern Oscillation (ENSO) Diagnostic Discussion issued by CLIMATE PREDICTION CENTRE/NCEP/NWS and the International Research Institute for Climate and Society, October 9, 2014
[3] The actual thermal requirement is 33 MW however Atikokan’s minimum production is 50MW.
[4] Presently nuclear supplies 50+ % of the power in Ontario. That is made up of Darlington, Pickering and the Bruce stations. Presently the Bruce station is leased from OPG until about 2020. Even if this lease is extended the Bruce will need extensive refurbishment if not outright shutdown, similar for Pickering. Starting around 2020 the Darlington nuclear station will start refurbishment. As a result nuclear power steady supply will not be a given commencing in 2020. Extra power availability for the new east west tie might not be steadily supplied.
[5] As noted previously, the AGS can only run at full capacity for a minimal length of time and then must shut down for refueling. Significant investment would be required, either in terms of additional storage and/or enhanced capacity of the two suppliers to increase their ‘just in time’ supply of biomass. Alternatively, while the AGS could run at full load for the entire year, the ability of the suppliers to meet that requirement would be difficult to achieve. The use of advanced biomass could augment the existing supply using exterior storage.
[6] IBID
[7] IBID
[8] Minimum output available
[9] Conversion of unit 2 is even more involved than Unit 3 as it not only needs mechanical conversion but also upgrades to the controls system. The control system conversion is not straight forward and is very technical because of the type of computer control presently used and complexity of changing to a completely new format. A whole new approach is needed and would require engineering planning starting immediately. The ETF has been advised that it is realistic to expect that the conversion could be completed within the timeframe noted.
[10] One organization has been advised that it would take an output of 100,000 tonnes annually to create a business case for the development and operation of an advanced biomass processing facility in Northwestern Ontario. Another has suggested that it would take a contract of 1,000,000 tons to be viable. Additional research will be required to confirm the viability targets for the production of advanced biomass on a sustainable commercial basis.


