
THUNDER BAY – Turkey dinner, family gatherings, and having too much to eat with family and friends is a goal for many this Thanksgiving weekend. Yet across Ontario countless others are helping out cooking meals for shelters and other agencies to ensure that those who don’t have enough to eat can have a good holiday meal.
During this federal election, the issues of poverty, and child poverty seem to be lost in the ongoing battles over immigration, and some of the battles between party leaders over who is, or is not ready. Perhaps we might have too many people missing the realities of life for many in our country.
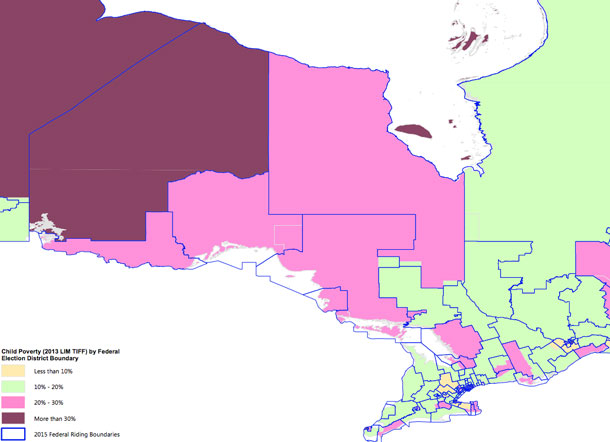
While no riding in Canada is immune from child poverty, according to the latest research from Campaign 2000: End Child and Family Poverty in Canada. A striking new series of maps demonstrates that child and family poverty persists in every riding from coast to coast to coast.
For Northwestern Ontario, the entire region according to the study has higher levels of child poverty than the national average. Campaign 2000 states, “With over 1.3 million children living in poverty in Canada, the issue affects all Canadians and must be addressed by all parties before election day on October 19th. ”
The maps can be viewed via www.campaign2000.ca.
“On the eve of Thanksgiving, the maps are an unsettling reminder of Canada’s child poverty epidemic,” notes Anita Khanna, national coordinator of Campaign 2000. “The mapping reveals 147 ridings with child poverty rates higher than 19%, the national average. Canada’s shameful levels of poverty among Indigenous children are also evident. Churchill Manitoba, where 65% of children live in poverty, has the deplorable distinction of being the federal riding with the highest rate in Canada.”
For the political parties and leaders, along with elected officials across the region, the stark contrast of our region should serve as a major impetus for working on changing this paradigm.
All federal parties have pledged to eliminate child poverty three times – in 1989, 2009 and most recently in February 2015; but there has been no sustained or significant reduction in child and family poverty since 1989. The federal government’s lack of significant action against child poverty is out of step with Canadians’ concerns about poverty. This week, countless communities are organizing food drives and making generous donations to assist local families. Many municipal, regional, provincial and territorial governments have prioritized poverty reduction across the country. The time has come for federal politicians to exercise leadership and commit to concrete action against child poverty in the next mandate.
“Child poverty has been virtually ignored through the election despite the harsh realities faced by children and families living in the communities chosen for every campaign stop. In this last leg of the campaign, each party needs to address the issue. We urge all parties to respond immediately to the crisis with a clear action plan to end child poverty for good,” added Khanna.
Trends & Background
- This is the first time that child poverty rates have been mapped by riding at the national level.
- The interactive maps present a snapshot of child poverty rates from 2013, the most recent data available from Statistics Canada. The child poverty rates are mapped according to 2013’s 308 riding boundaries, the most recent available data. The data source is Statistics Canada 2013 Taxfile (T1FF), Table 18. The new 338 ridings have been superimposed on the 2013 riding boundaries and can be accessed in PDF form at www.campaign2000.ca.
- The mapped ridings are divided into 4 ranges. The first range includes ridings with child poverty rates below 10%, the second is 10-20%, the third 20-30% and the fourth 30% and above.
- The first range contains 27 ridings; the lowest child poverty rate is in Lotbinière – Chutes-De-La-Chaudière Quebec. 21 ridings are located in Quebec, 2 are in Alberta and 4 are in Ontario.
- The second range has 149 ridings, the third has 99 ridings and both consist of a cross section of the country’s ridings. Seventeen of the ridings in the second range have child poverty rates above the national average of 19%.
- The fourth range has 29 ridings, spanning Saskatchewan, Manitoba, Ontario, Quebec, Nunavut and Nova Scotia. Eight Torontoridings have child poverty rates above 30%.
- Cross referencing the data with National Household Survey’s findings reveals that marginalized children and families are over-represented in the fourth range when compared with the first. For example, 9.1% of the families in the first range are immigrants compared to 33% of those in the fourth range. The same trend appears among visible minorities and Indigenous children.
Make A Difference!
Often people across Canada will tune in to their television, or help local and national causes that seek to help fight poverty in far-off lands. Making a difference right here at home is just as important, and will make a real difference right here in Northwestern Ontario. That is not to demean the well meaning efforts across our region of the many people reaching out globally, but perhaps it is time more of us focused more energy and efforts right here in Northwestern Ontario.
Get Involved! Volunteer at Shelter House, Dew Drop Inn, Grace Place, or any other local group working to make a difference right here at home. Make regular donations to the Regional Food Bank. Start getting engaged with politicians and community leaders along with church leaders to step up.
In Thunder Bay, we have many looking to major mega-projects seeing in them the solutions to what troubles our region.
There are many ways to fix the local poverty situation, action is the best policy we can adopt. The time for study and words are over.
James Murray


