If you want to advance your trading career, one of the key things you need to learn is chart patterns and how to interpret them. Having a good understanding of these patterns will help you know when a trend is starting or ending, and when to start and end a trade. All you need to do is to find a suitable forex and CFD broker and use their charting platforms to create the patterns. This article will highlight some of the most common chart patterns you need to know. The best free forex trading signals can be found online.
Double Bottom and Double Tops
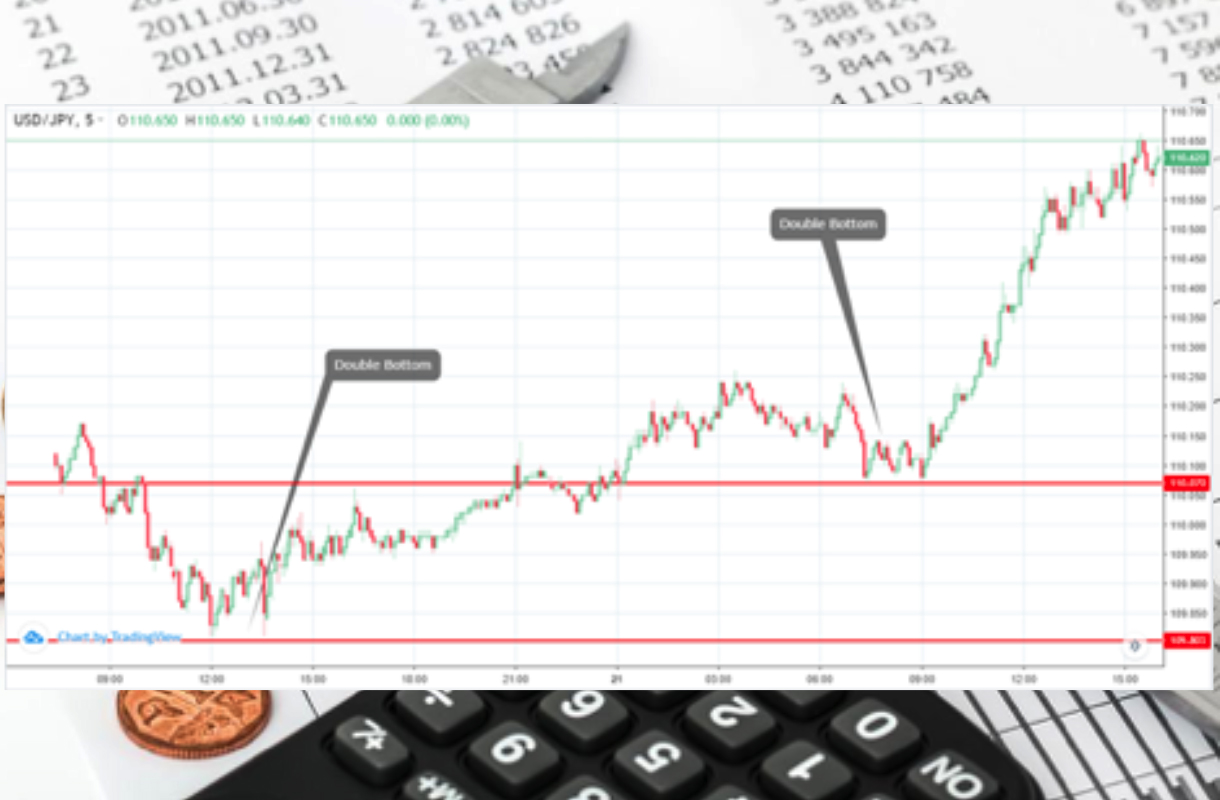
A double bottom is a reversal pattern that happens when a downward trend is starting to move upwards.
As a result, the pattern is useful when initiating buying trades when the asset is moving in a downward trend. To spot it, you first need to identify a downward trend. Second, the asset price should move up, and then move downwards again to the previous low. The example below for the USD/JPY pair shows two double bottom setups.
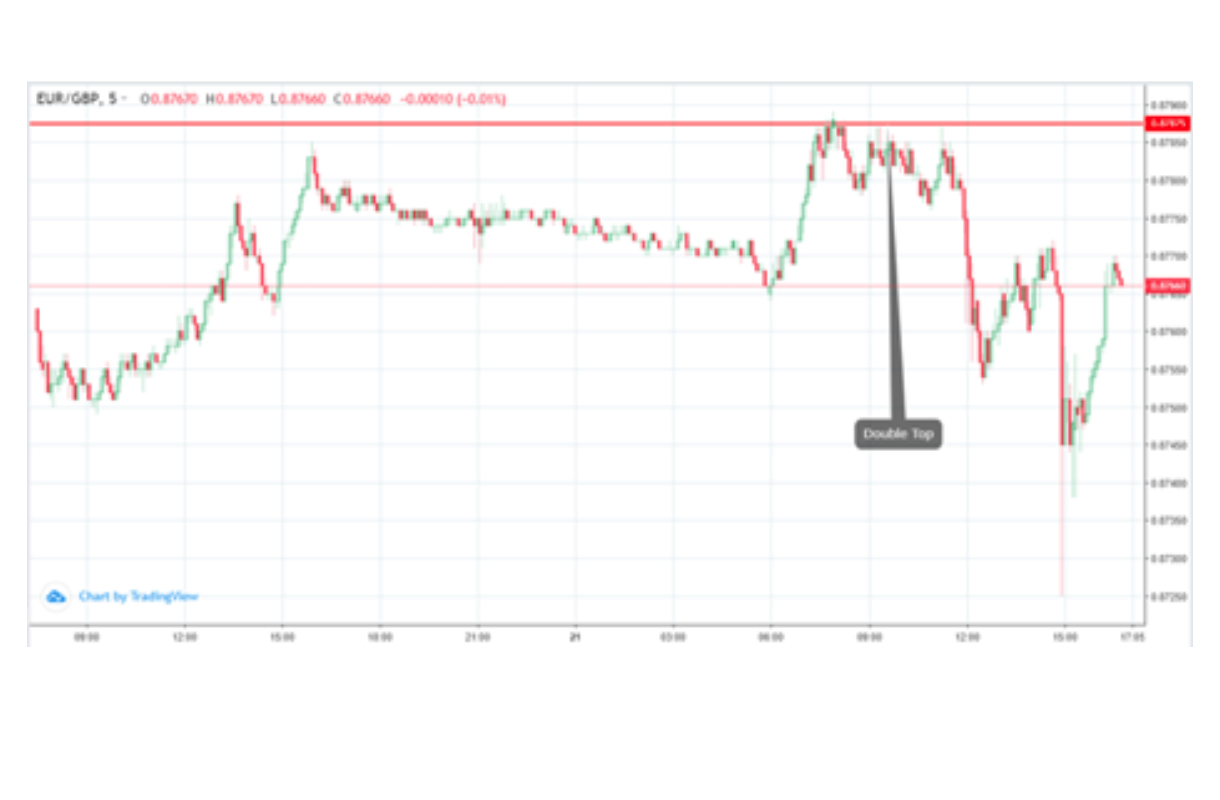
The double top is the opposite of the double bottom and is used to identify the opportunities to short. An example of double top is shown below.
Head and Shoulder Pattern
Head and shoulders is a reversal pattern commonly used in uptrend. When it occurs, it usually sends a signal that the price of the asset could reverse. It happens when a peak – shoulder – is followed by a higher peak – head – and then by a lower peak. The neckline is drawn by connecting the lowest points of the two troughs. An example of this pattern is shown below.
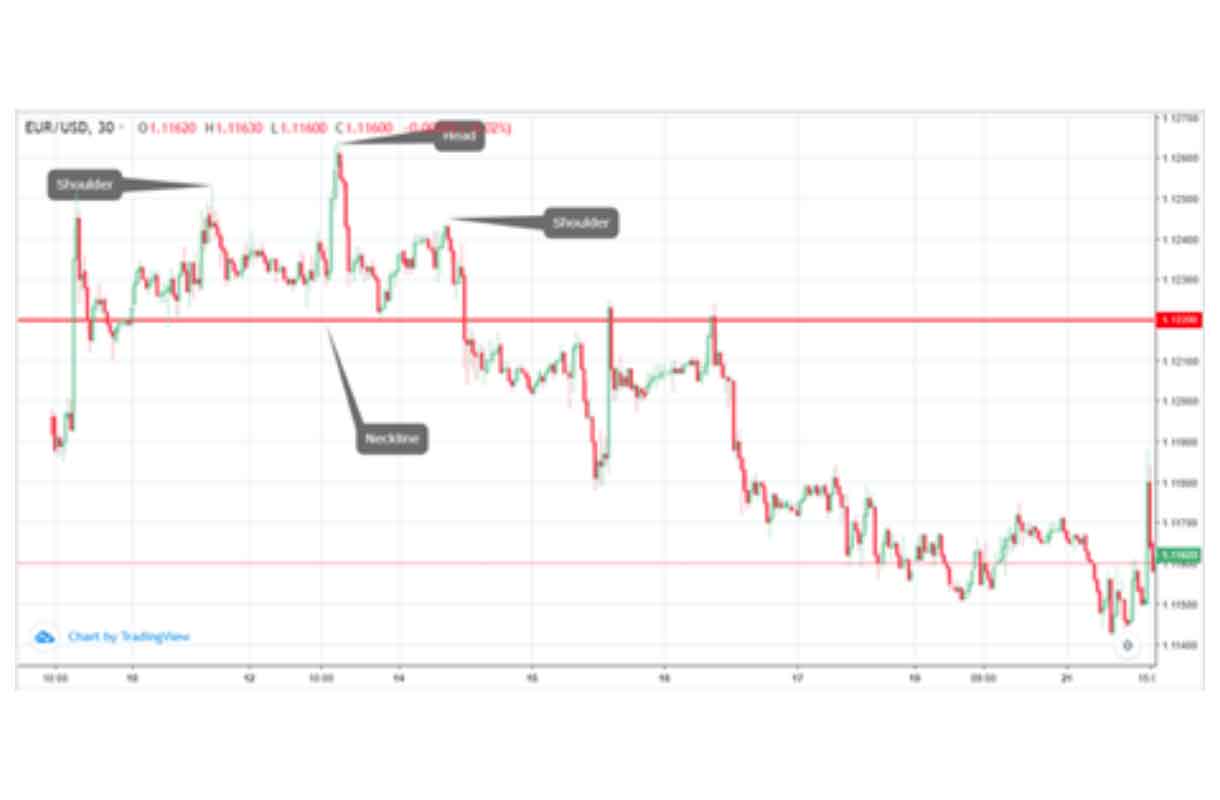
The inverse head and shoulder pattern is used to identify buying signals and is drawn similar to the above example.
Triangle Pattern
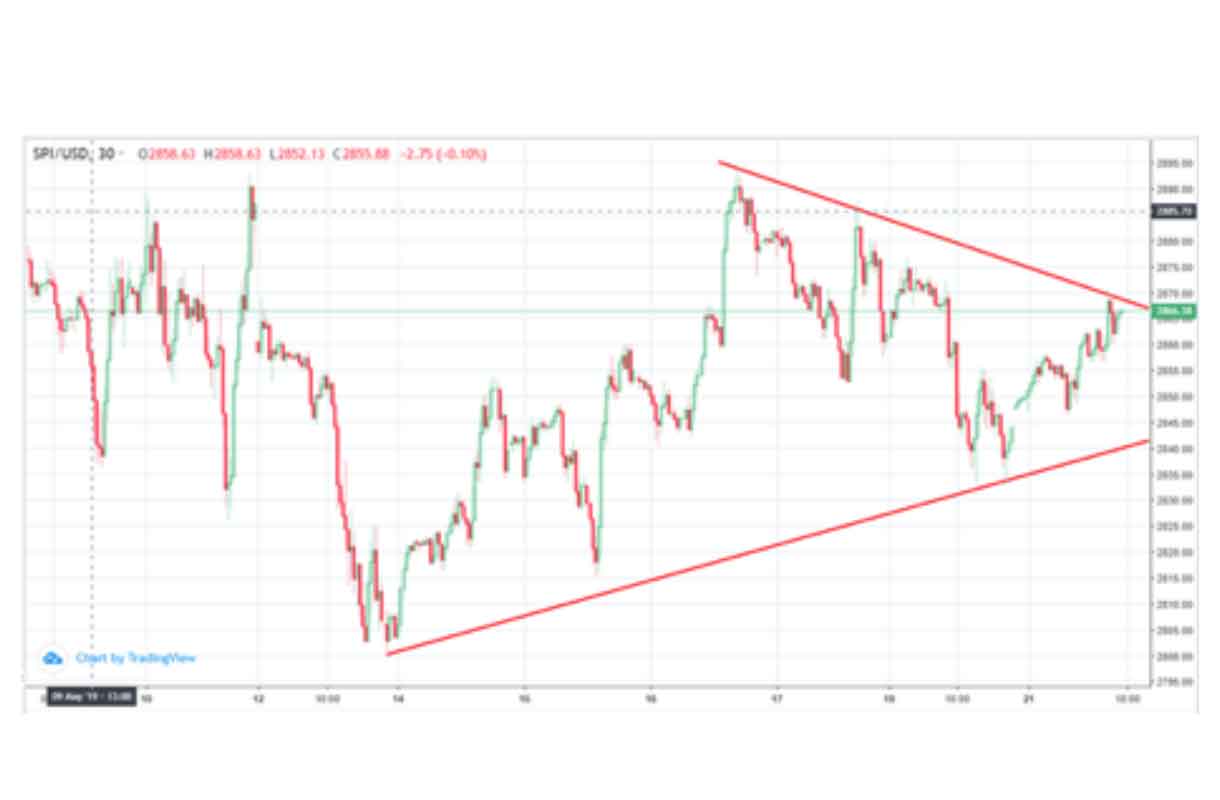
The triangle pattern is a common pattern that is easy to spot. It is used to anticipate when a breakout could occur. There are three types of triangle patterns: symmetrical triangle, ascending triangle, and descending triangle. In a symmetrical triangle, the slope of the price’s high and the slope of the low converge in a pattern that resembles a triangle. In this period, the asset makes lower highs and higher lows. As a result, the buyers and the sellers are not yet decided. While not always, the pattern tends to happen ahead of a major release like an interest rates decision. An example of this is shown on the S&P 500 chart below.
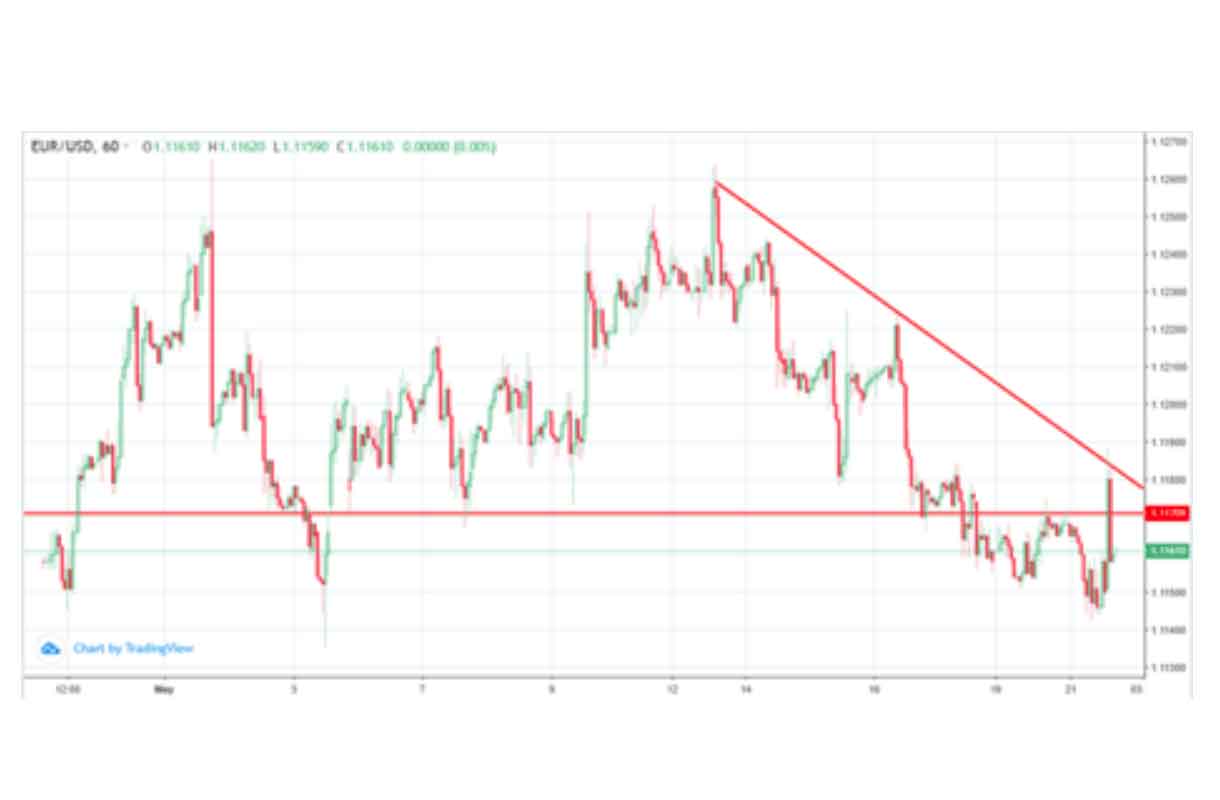
In a descending triangle, there is a string of lower highs, which act the support. The price of the asset tends to form gradual lower highs. This implies that the sellers are starting to gain some ground against the buyers. When this happens, professional traders place trades that are above the upper line. An example of this is shown below.
The opposite of this is the ascending triangle, which forms when buyers find a resistance level that the buyers can’t exceed. As they decide on where to push the price, the price gradually starts to push the price up, creating higher lows.
Rectangle Patterns
As the name suggests, these are patterns where there is an indecision in the market. With this, the buyers have a limit on how high a price can move up while the sellers have a limit on how low the price can go. When this happens, a pattern with horizontal support and resistance level is formed. As a result, the price tends to test the support and resistance levels several times and then breaks out in either direction. An example of this is shown on the 30-minute chart of Brent crude oil shown below.
Other than this, there are two types of rectangles. The bearish rectangle happens when the price consolidates for a short period during a downtrend. This happens as sellers pause to assess whether the downward trend will continue once more. A bullish triangle on the other hand happens when there is consolidation during an uptrend.
These chart patterns are then classified into three main groups. These groups are: reversal patterns (double top, double bottom, and head and shoulders), continuation patterns (rectangles), and bilateral chart patterns like triangles.
While these are the most common chart patterns, you too can identify and create your patterns. As you will realize, understanding these patterns will make you a better trader.