
Credit: NASA JPL, Ed Olsen
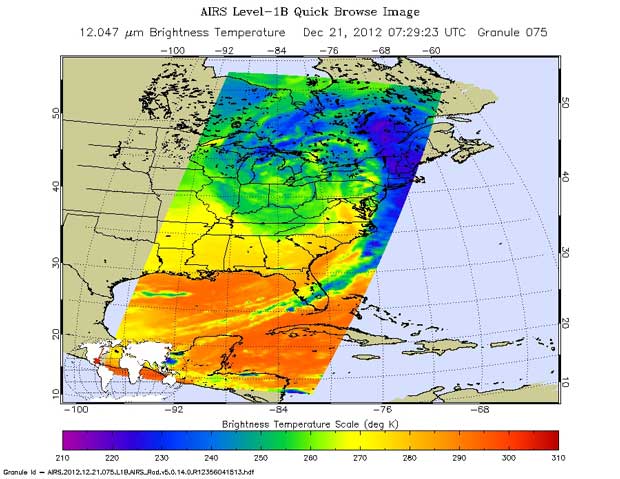
THUNDER BAY – NASA satellite images offer a view of how weather systems or mankind can impact our planet. While people across the mid-west United States and southern Ontario, Quebec and the Maritimes were snowed in over the past week, the images from space show the storm.
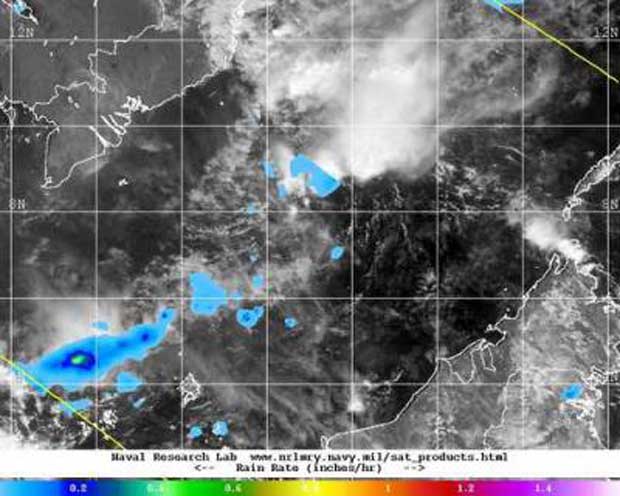
The NASA TRMM satellite captured rainfall data on Tropical Depression Wukong as it struggles to stay together in the South China Sea. Wukong has been battered with wind shear for days and NASA satellite data still shows an area of moderate rainfall within the dying storm.
NASA’s Tropical Rainfall Measuring Mission or TRMM satellite passed over Tropical Depression Wukong on Dec. 28 at 0328 UTC (10:28 p.m. EST, Dec. 27) and saw one area of moderate rainfall near the center of circulation. That area was generating a rainfall rate of about 1 inch/25 mm per hour. Most of the other precipitation in the storm is lighter and scattered.
On Dec. 28 at 0900 UTC (4 a.m. EST) Tropical Depression Wukong had maximum sustained winds near 25 knots (28.7 mph/46.3 kph). Satellite data helped pinpoint Wukong’s center near 8.7 north latitude and 111.0 east longitude, about 280 miles (322 miles/518.6 km) east of Ho Chi Minh, Vietnam. Wukong continues to move to the west-southwest staying south of Vietnam.
Wukong is moving around the southern edge of a ridge (elongated) area of high pressure and being battered with moderate southeasterly vertical wind shear. According to the forecasters at the Joint Typhoon Warning Center (JTWC), the wind shear has exposed the low level circulation center.
JTWC forecasters expect the depression to continue moving west-southwest over the next day or two before finally dissipating.
The images from space can also demonstrate the impact of changing weather patterns, and long-term impact of climate change. In September, NASA captured images from space of the Arctic and Antarctic ice pack. The northern ice pack was reported as the smallest in recorded history. Meanwhile, at the opposite pole, the ice was larger than usual.
A new NASA study shows that from 1978 to 2010 the total extent of sea ice surrounding Antarctica in the Southern Ocean grew by roughly 6,600 square miles every year, an area larger than the state of Connecticut. And previous research by the same authors indicates that this rate of increase has recently accelerated, up from an average rate of almost 4,300 square miles per year from 1978 to 2006.
“There’s been an overall increase in the sea ice cover in the Antarctic, which is the opposite of what is happening in the Arctic,” said lead author Claire Parkinson, a climate scientist with NASA’s Goddard Space Flight Center, Greenbelt, Md. “However, this growth rate is not nearly as large as the decrease in the Arctic.”
The Earth’s poles have very different geographies. The Arctic Ocean is surrounded by North America, Greenland and Eurasia. These large landmasses trap most of the sea ice, which builds up and retreats with each yearly freeze-and-melt cycle. But a large fraction of the older, thicker Arctic sea ice has disappeared over the last three decades. The shrinking summer ice cover has exposed dark ocean water that absorbs sunlight and warms up, leading to more ice loss.
On the opposite side of the planet, Antarctica is a continent circled by open waters that let sea ice expand during the winter but also offer less shelter during the melt season. Most of the Southern Ocean’s frozen cover grows and retreats every year, leading to little perennial sea ice in Antarctica.


